Introduction
The quality control of biopharmaceuticals such as antibodies must be performed to ensure quality and safety. The quality of antibodies is affected by process parameters such as pH, temperature, CO2, and cell culture metabolites. While standard physicochemical methods such as mass spectrometry characterize composition, biological activity must also be verified.
Endpoint assays such as ELISA have traditionally been used for this purpose, but they do not provide kinetic or affinity data. Surface Plasmon Resonance (SPR) is a powerful label-free alternative that enables real-time assessment of protein interactions with minimal sample preparation. However, access to large centralized SPR systems is limited, costly, and requires sample transport and pre-storage.
Portable SPR devices offer a practical solution — giving scientists quick, on-bench access to kinetic and affinity data without compromising sensitivity or specificity. In this application note, we demonstrate the use of the P4SPR to determine which source of anti-nucleocapsid antibody exhibits the best binding performance with SARS-CoV-2 nucleocapsid recombinant protein.
Experimental Procedures
A more detailed procedure is described in the ChemRXiv paper by Djaileb et al. [6]. The detection scheme (Figure 1) shows anti-nucleocapsid antibody binding to immobilized SARS-CoV-2 nucleocapsid protein on the P4SPR gold sensor surface.
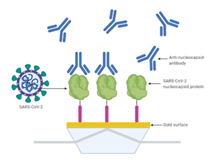
The gold sensor surface was modified with Afficoat, then treated with EDC/NHS and washed with sodium acetate. A SARS-CoV-2 nucleocapsid recombinant (rN) protein solution (10 µg/mL) was immobilized for 20 min, followed by blocking with 1 M ethanolamine (pH 8.5) to reduce non-specific adsorption.
Anti-nucleocapsid antibody solutions (10 µg/mL) from four different sources (Table 1) were manually injected sequentially. SPR responses were collected simultaneously across three sample channels (A–C) for triplicate measurements, plus one reference channel (D) using anti-RBD antibody to correct for temperature and bulk refractive index fluctuations.
Injection Sequence
| Injection # | Antibody Source |
|---|---|
| 1 | AB1, lot A |
| 2 | AB1, lot B |
| 3 | AB2, lot A |
| 4 | AB1, lot C |
Table 1. Sequence of injection and source of anti-nucleocapsid antibody. Highlighted row = highest SPR response.
Results and Discussion
The entire experiment — testing 4 different antibody sources — took just over 2 hours. The average injection time was ~18 minutes, with injection and regeneration averaging 25 minutes per cycle.
Figure 3 shows the SPR response for the first two antibody sources across all three sample channels (green, red, black), with the reference channel in blue. The association phase of anti-nucleocapsid antibody toward the immobilized nucleocapsid protein is clearly visible.

Figure 4 shows the average sensorgrams across all three sample channels for all four injections. Each sensorgram represents a different antibody source.

Figure 5 shows the average resonance unit (RU) response for each antibody source. AB1, lot B (Injection #2) exhibited the highest SPR response — indicating superior binding activity to the SARS-CoV-2 nucleocapsid protein.
It is also noteworthy that the dissociation equilibrium constant (Kd) can be determined from manual injections using increasing concentrations of antibody or target — see Application Note 1 — Gene Regulation / Lac Operon for an example.
P4SPR Advantages for Antibody QC
Speed
Four antibody sources screened in just over 2 hours with ~18 min per injection cycle.
No Labels Required
Label-free detection — no fluorophores or enzyme-linked antibodies that could mask true binding behaviour.
Minimal Sample Prep
Antibody samples can be directly injected without extensive preparation steps.
Real-Time Kinetics
Sensorgrams capture association and dissociation in real time — data ELISA cannot provide.
Multichannel Precision
Three sample channels plus one reference channel yield triplicate measurements with built-in drift correction.
Portable & On-Bench
No need to pre-store or transport samples to a core facility. Run QC where the samples are.
Conclusion
A portable SPR instrument can rapidly identify which antibody source delivers the best binding performance — within a single working session. This reduces wasted time on less biologically active lots before downstream experiments begin. The P4SPR provides a fast, label-free alternative to ELISA for quality control of antibodies and other biopharmaceutical products.
References
- M. Zschatzsch et al., "Monitoring bioactive and total antibody concentrations for continuous process control by surface plasmon resonance spectroscopy," Eng. Life Sci., vol. 19, pp. 681–690, 2019.
- P. Thillaivinayagalingam et al., "Biopharmaceutical production: Applications of surface plasmon resonance biosensors," J. Chromatogr. B, vol. 878, pp. 149–153, 2010.
- C. Gassner et al., "Development and validation of a novel SPR-based assay principle for bispecific molecules," J. Pharm. Biomed. Anal., vol. 102, pp. 144–149, 2015.
- Affinité Instruments. Available: affiinstruments.com
- H. Wang et al., "Development of biosensor-based SPR technology for biological quantification and quality control of pharmaceutical proteins," J. Pharm. Biomed. Anal., vol. 50, pp. 1026–1029, 2009.
- A. Djaileb, "A Rapid and Quantitative Serum Test for SARS-CoV-2 Antibodies with Portable Surface Plasmon Resonance Sensing," ChemRXiv, April 15, 2020.
Acknowledgements: We thank Abdelhadi Djaileb from Dr. Jean-François Masson's lab, Université de Montréal, for the collection of these data.
About the Author: Dr. April Wong is an analytical chemist with over a decade of research experience in biosensors. She obtained her Ph.D. at the University of Toronto.