Introduction
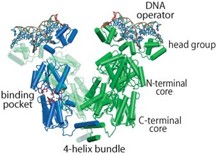
The regulation of the lac operon (lacO), a set of Escherichia coli genes responsible for lactose metabolism in the bacteria, by the lac repressor is a well-studied system in molecular biology. The lac repressor, a DNA-binding protein (lacI), is key to controlling the lac operon. The equilibrium dissociation constant (KD) of this system is estimated to be in the nM range.
This lacO / lacI system is often introduced in the context of gene regulation in biochemistry and biology classes at the undergraduate level. More advanced research on lacO / lacI includes applications in imaging and chromatin editing.
In a broader context, SPR studies of protein–DNA complexes are important in understanding gene expression regulation pathways.
The binding strength (affinity, KD) of the lacO / lacI system was determined with the P4SPR in an academic lab at the Université de Montréal. The easy-to-use P4SPR and user-friendly interface allowed lab technicians to develop an SPR assay to demonstrate this biological system in undergraduate lab classes.
Experiment Setup
1System Setup
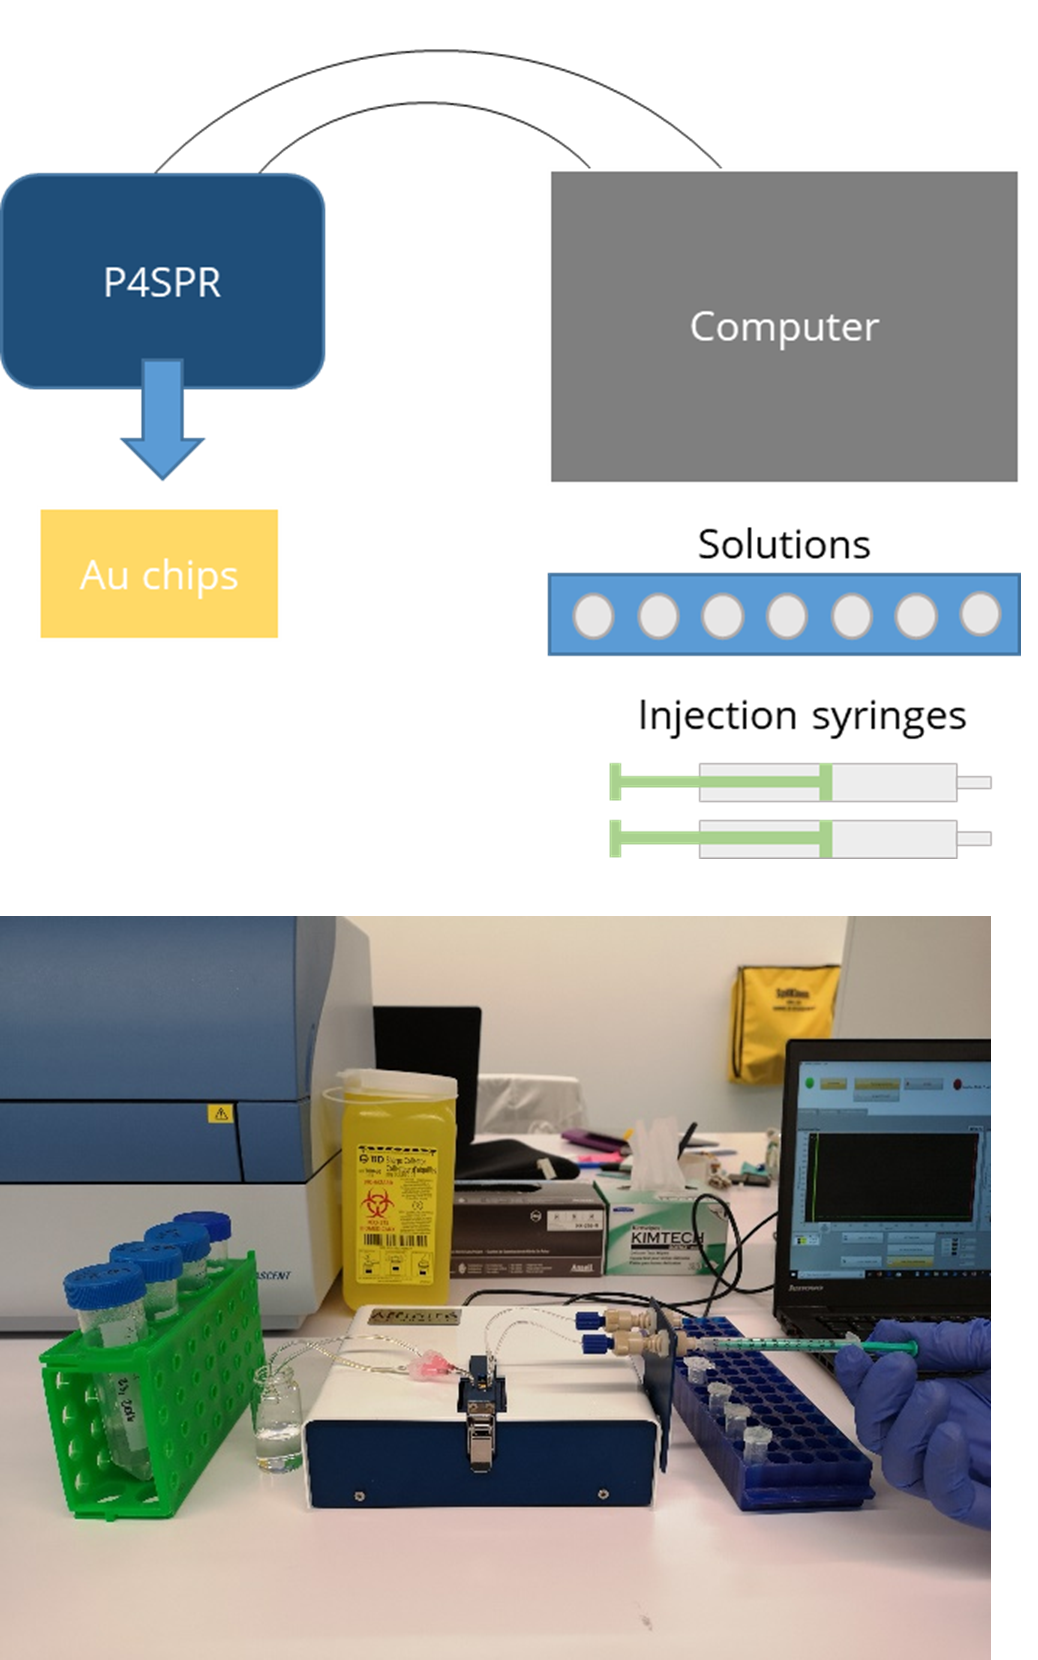
The USB-powered P4SPR can be connected to a laptop to initiate operation control and data recording using the P4SPR Control software. With its user-friendly design, the P4SPR can be set up easily. The microfluidic cell (Figure 3) is capped over the gold sensor chip and tightly secured in the sensor chip cavity before injecting solutions in both sample and reference channels for baseline stabilization.
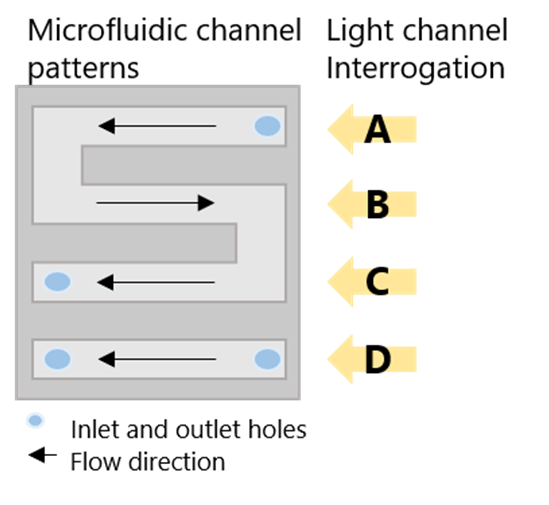
The S-shaped sample channel has 3 parallel sensing areas which can provide triplicate sample measurements along with one control measurement with the reference channel. Bubbles formed in the channels can be visually seen through the exposed clear channels for immediate removal to prevent any loss of signal.
2Experimental Procedures
(5 min)
- Baseline stabilization
(1 h)
- Probe immobilization
- MCH spacer immobilization
- DNA hybridization
- Wash
(10 min each)
- Signal stabilization
- Inject lacI (5 nM)
- Wash
- Regeneration
- Wash
- Repeat with 20, 50, 100, 200 nM
After baseline stabilization, thiolated lacO DNA was injected into the sample channel. Immobilization occurred spontaneously via strong gold–sulfur bond formation until surface saturation, shown by the SPR signal plateau. The complementary lacO oligomer was then injected to allow for hybridization. The sensor surface was washed thoroughly before the binding assay.
A stock lacI protein solution was used to prepare solutions of 5, 20, 50, 100, and 200 nM. Each solution of increasing concentration was sequentially injected and incubated for 10 minutes, with abundant washing solution and regeneration buffer in between to remove remaining lacI proteins from the previous injection.
Data from all 4 channels were recorded and then exported to Excel for further data analysis.
Results and Discussion
In this experiment, 3 parallel binding curves were generated from the sample channels. The signals were averaged and subtracted from the reference channel signal. The resulting SPR signal is plotted against time (Figure 5).
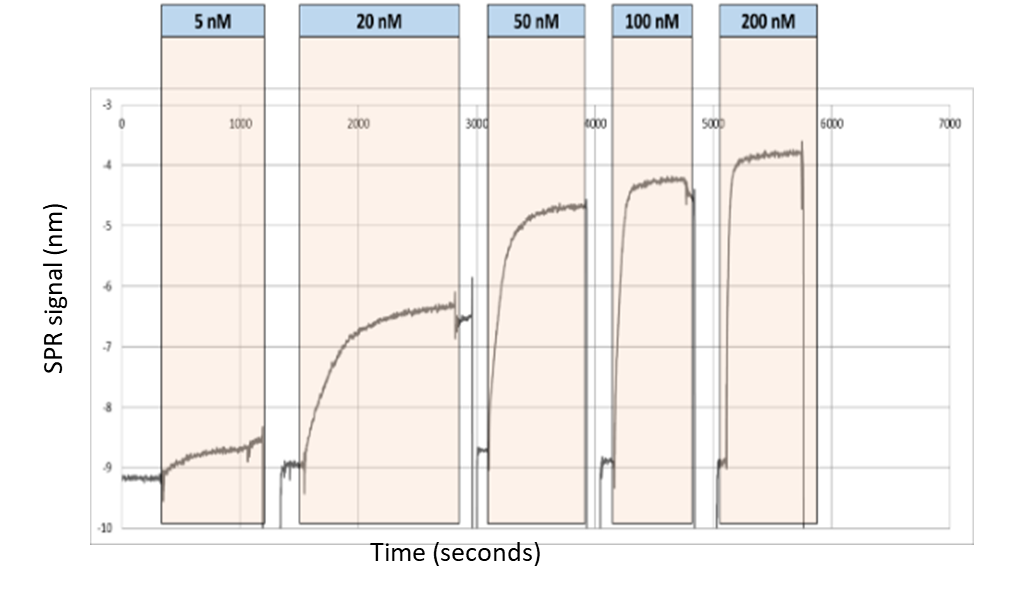
The binding shifts corresponding to different concentrations of lacI are used to establish the binding isotherm and hence determine the KD (Figure 6).
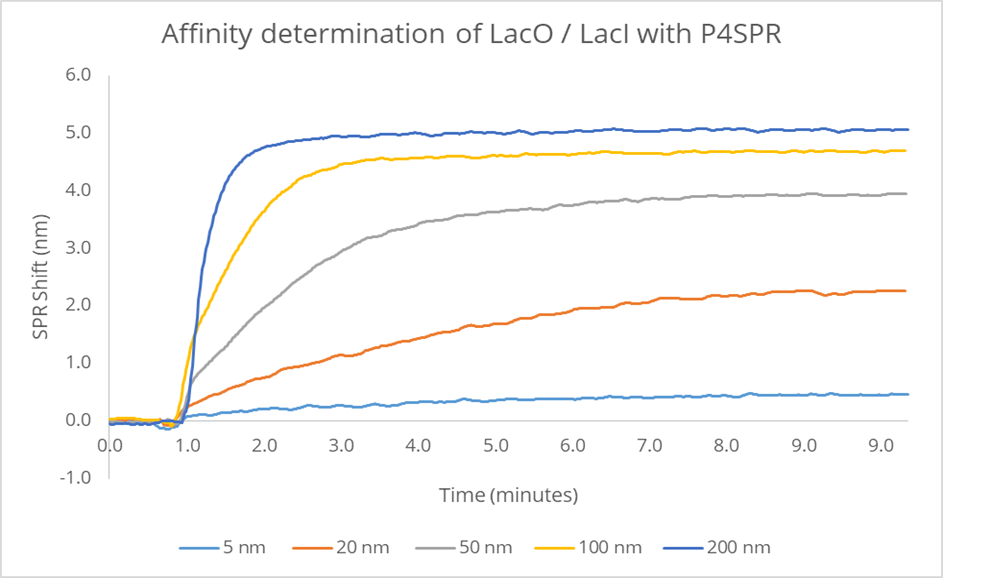
The measured KD is in concordance with the literature-reported value in the same low nM range for lacI-based transcription repressor proteins.1 Unlike the DNA binding assay used in the published paper, this SPR assay required no DNA radiolabeling and monitored binding interactions in real time.
The P4SPR Advantages
Modular & Mobile
Compact, USB-powered design allows benchtop or field deployment with minimal infrastructure.
Multichannel
Four simultaneous channels (3 sample + 1 reference) enable triplicate measurements with built-in reference subtraction.
Minimal Sample Prep
No purification kits or radiolabels required — rapid setup saves time and reduces reagent costs.
High Sensitivity
Thin-film SPR provides deep evanescent field penetration for accurate affinity determination in the nM range and beyond.
Conclusion
The P4SPR successfully characterized the binding interaction of the lac operon DNA and its repressor protein, and the result was validated with published literature. This experiment allowed undergraduate students to familiarize themselves with the technology and its application in monitoring biomolecular interactions.
The P4SPR is also a useful tool for characterizing other biological systems such as DNA–DNA, RNA, and aptamer pairs, helping scientists better understand binding and uncover function in biological pathways.
Acknowledgements
We would like to thank Philipe Lampron, Shona Teijeiro, and Sébastien Truche of the Université de Montréal Biochemistry department for developing the assay.