Introduction
The CD36 (cluster of differentiation 36) is part of transmembrane proteins with versatile functions. Encoded by the CD36 gene, the CD36 protein is found on the surface of many cell types in vertebrates. It has various roles in lipid uptake, cell adhesion, and pathogen sensing. As a result, several diseases related to arterial hypertension, diabetes, and cardiomyopathy are associated with mutation or misregulation of these transmembrane proteins.
Despite having important roles, the precise mechanism by which these proteins function has not been well understood. Literature has reported many studies based on in vitro biochemical assays in which a large number of ligands as well as ligand-binding regions in these proteins were identified. Evidence also showed that ligand/CD36 protein interactions are potentially involved in mediating ligand translocation across the membrane and receptor-mediated ligand internalization. However, the relevance of these uncovered biochemical properties of CD36 proteins has not been extensively verified in its native environment.
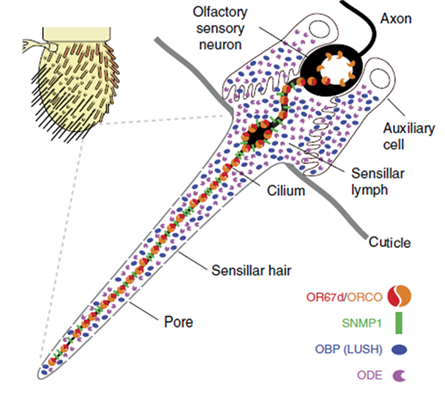
One genetic model of particular interest, Drosophila melanogaster, offers a useful system to investigate CD36 protein function in vivo as it is known to have 14 CD36-like proteins. One of the Drosophila CD36 family members called sensory neuron membrane protein 1 (SNMP1) is expressed in olfactory sensory neurons (OSNs), which detect lipid-derived pheromones. SNMP1 is found in the dendritic cilia of the insect where the odorant receptors (ORs) are also located (Figure 1). The better-understood function of Drosophila SNMP1 in OSNs is its detection of the male sex pheromone (Z)-1-octadecenyl acetate (cis-vaccenyl acetate, cVA). Lack of SNMP1 reduces sensitivity of these neurons to cVA stimulation. Therefore, SNMP1 plays an important role in the pathway, but its mechanism of action is not clear.
Surface Plasmon Resonance (SPR) has shown label-free sensing and real-time monitoring benefits in studying biomolecular interactions to elucidate pathways. In this application note, as a complementary technique to structure-function characterization of SNMP1 with molecular genetic, cellular, biochemical, electrophysiological, and homology modelling approaches, the P4SPR was employed to study the binding interaction of different insect pheromones and the CD36 protein.
Experimental Setup
P4SPR Device Setup
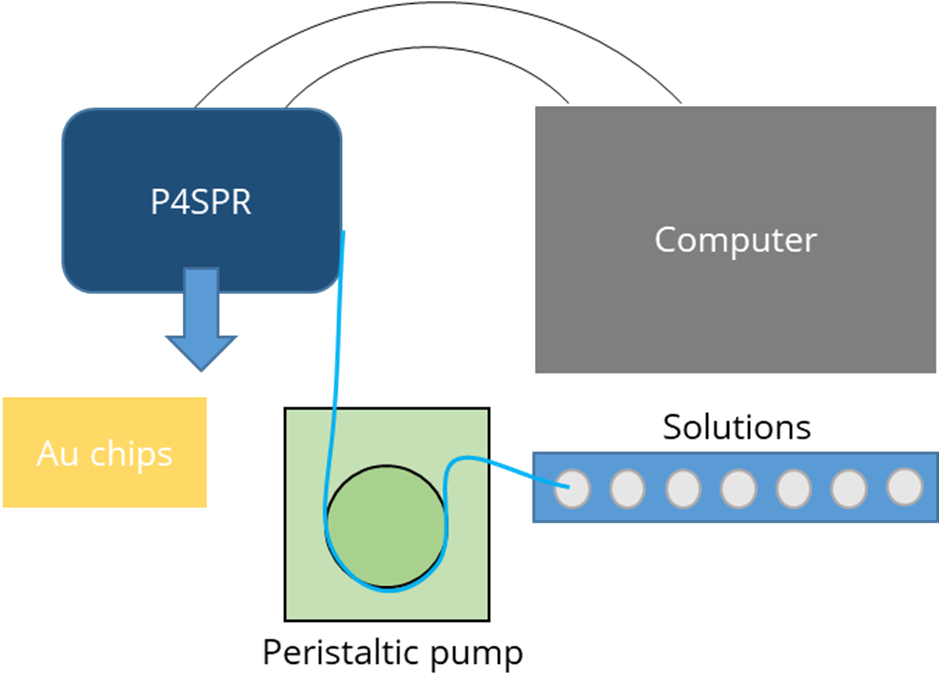
The USB-powered Portable, 4-Channel SPR (P4SPR) was connected to a laptop to initiate operation control and data recording using the P4SPR Control software. A peristaltic pump was easily integrated in-line with the P4SPR to ensure consistent solution flow onto the SPR chips (Figure 2). Experiments were performed on Au SPR chips inserted in the cell holder of the P4SPR. A PDMS microfluidic cell (Figure 3) was placed on top of the SPR chip and firmly pressured in place with the P4SPR cover to avoid any leaks.
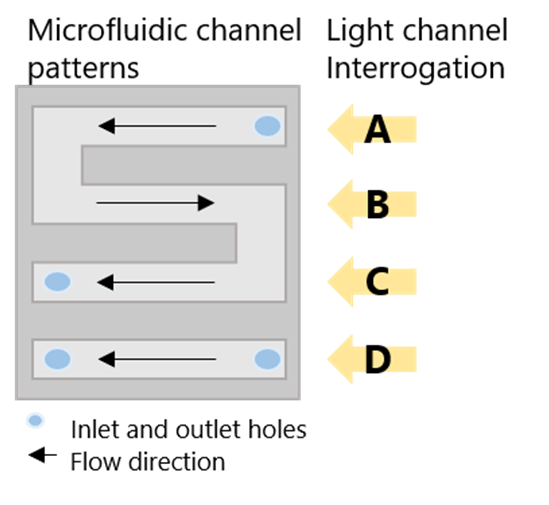
The microfluidic cell is patterned with an S-shaped channel and a linear one, both connected to their respective inlet and outlet ports. During the experiment, sample solutions were flowed into the S-shaped channels whereas control solutions flowed over the other channel. The S-shaped channel has 3 parallel sensing areas which can provide triplicate sample measurements for better precision. Setting up the device to be ready for experiments took less than 5 minutes.
Experimental Procedures
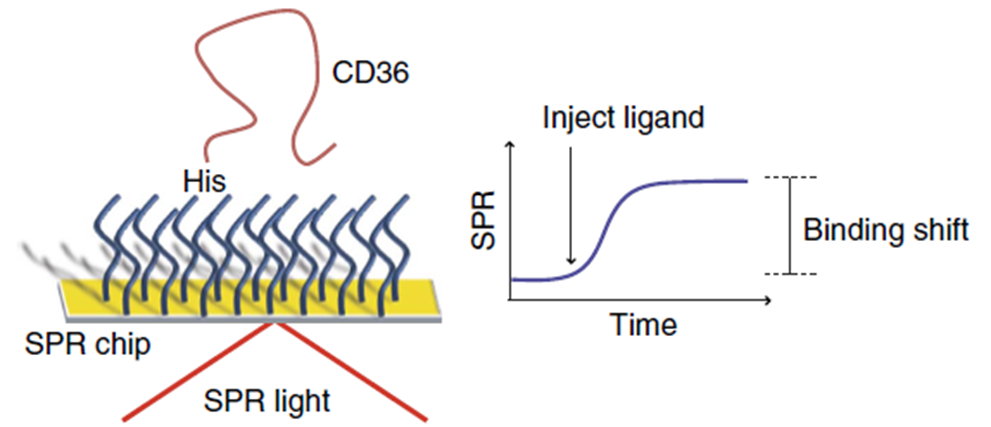
First, the surface of Au SPR chips were coated with a peptide self-assembled monolayer with functions analogous to Ni-NTA to bind His-tagged proteins. Since the ectodomain of SNMP1 was difficult to express and given the homology in structural features, mammalian CD36 was used as a substitute for the binding studies. The immobilization of His-tagged CD36 was done after 15 minutes with the introduction of a highly concentrated His-tagged CD36 protein solution (Figure 4).
In total, the binding interactions of 9 pheromone molecules with CD36 protein were investigated. Ligands were prepared in PBS at concentrations between sub-mM and mM. The solubility of hydrophobic ligands in PBS was increased by adding 0.1% dimethylsulfoxide to the buffer. Every SPR step from immobilization to assay was monitored in real-time. Ligand solutions were injected successively from low to high concentrations. For each ligand, the time of analysis was 30 minutes where 6 different concentrations were flowed through the P4SPR. SPR shifts at the thermodynamic equilibrium were recorded and plotted to determine the affinity curve for each ligand. A Langmuir isotherm was fitted to the affinity curves to extract the equilibrium dissociation constant (KD) and maximum SPR signal using MatLab curve-fitting tools.
Results and Discussion
SPR Sensorgrams
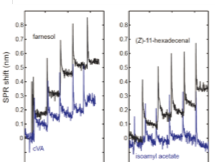
Results from SPR sensorgrams showed an increasing SPR shift with increased concentrations of farnesol, cVA, and (Z)-11-hexadecenal. For isoamyl acetate, no SPR shift was observed, suggesting little to no binding with CD36. It is important to note that in 30 minutes, 3 sensorgrams were collected in parallel, providing the standard deviation of the binding signal in the concentration-response curves.
Ligands Concentration-Response Curves and KD Comparison
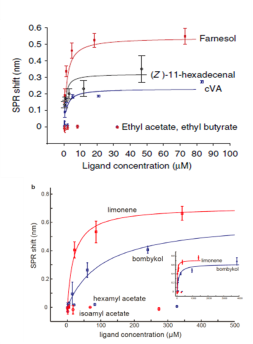
The concentration-response curves were established and overlapped for comparison. Five of the nine pheromone molecules exhibited binding measured by SPR (Figure 6). Lowest dissociation constants were measured for cVA, farnesol, and (Z)-11-hexadecenal, which are similar in magnitude to some of the known CD36-binding peptides (Figure 7).3
KD Summary
| Ligand | KD (μM) | ΔλSPR,max (nm) | Concentration range (μM) |
|---|---|---|---|
| cVA | 0.64 | 0.23 | 0.33–84 |
| Farnesol | 0.64 | 0.54 | 0.29–73 |
| (Z)-11-hexadecenal | 0.79 | 0.32 | 0.18–47 |
| Limonene | 20 | 0.71 | 5.4–1372 |
| Bombykol | 106 | 0.62 | 15–3859 |
| Ethyl acetate | No response | No response | 0.12–128 |
| Isoamyl acetate | No response | No response | 0.32–327 |
| Hexyl acetate | No response | No response | 0.27–273 |
| Ethyl butyrate | No response | No response | 0.12–128 |
Figure 7. KD and maximum SPR signal (ΔλSPR,max) for the indicated compounds. Highlighted rows indicate the three strongest binders.
Specificity and Sensitivity
The P4SPR Advantages
Modular & Portable
Easily integrated with a peristaltic pump or other flow delivery systems for consistent, controlled solution delivery.
Multichannel Precision
Three parallel sample channels provide triplicate measurements simultaneously, yielding standard deviation directly from each run.
Small-Molecule Sensitivity
Detects binding of low molecular weight ligands (88–250 Da) — a range challenging for many label-based assays.
Label-Free & Real-Time
Every step from immobilization to binding assay is monitored in real-time with no labeling required.
Conclusion
The P4SPR provided complementary binding information to further evidence direct binding of pheromone to the CD36 transmembrane protein responsible for subsequent intracellular tunneling effects. The P4SPR delivered invaluable information on the binding interaction and specificity of different pheromones with CD36 to further uncover its mechanism of action.
Acknowledgements
Affinité Instruments would like to thank Natalia Bukar and Jean-François Masson for optimizing and performing the SPR analyses and for writing up the experimental, results, and discussion sections on the SPR binding studies.
1 Hoebe, K. et al. CD36 is a sensor of diacylglycerides. Nature 433, 523–527 (2005).
2 Laugerette, F. et al. CD36 involvement in orosensory detection of dietary lipids, spontaneous fat preference, and digestive secretions. J. Clin. Invest. 115, 3177–3184 (2005).
3 Bolduc, O. R. et al. Modified peptide monolayer binding His-tagged biomolecules for small ligand screening with SPR biosensors. Analyst 136, 3142–3148 (2011).