Introduction
Surface plasmon resonance (SPR) instruments provide a wealth of information — kinetics, affinity, and concentration — depending on how the experiment is configured. Two fundamentally different setups enable SPR analysis: static and kinetic.
In a static system, the sample solution is introduced manually by syringe into the flow cell and interacts with the surface through diffusion. In a kinetic system, a sample loop is loaded (by manual syringe or autosampler), and the sample is introduced into the flow cell by flowing running buffer through the loop via a syringe pump.
This technical note compares features and describes how both modes can characterize biomolecular interactions. Two very similar polyclonal mouse anti-human IgG (MAH IgG) capture surfaces were created and characterized with binding of whole human IgG (Hm IgG).
Binding kinetics — key parameters
Using a basic Langmuir 1:1 binding model where an immobilized ligand (L) interacts with an analyte (A):
The rate constants kon and koff represent the association and dissociation reactions respectively. The dissociation equilibrium constant KD — expressed in molarity (M) — represents the concentration at which half of the immobilized ligands are bound:
Static vs. Kinetic: What Each Mode Provides
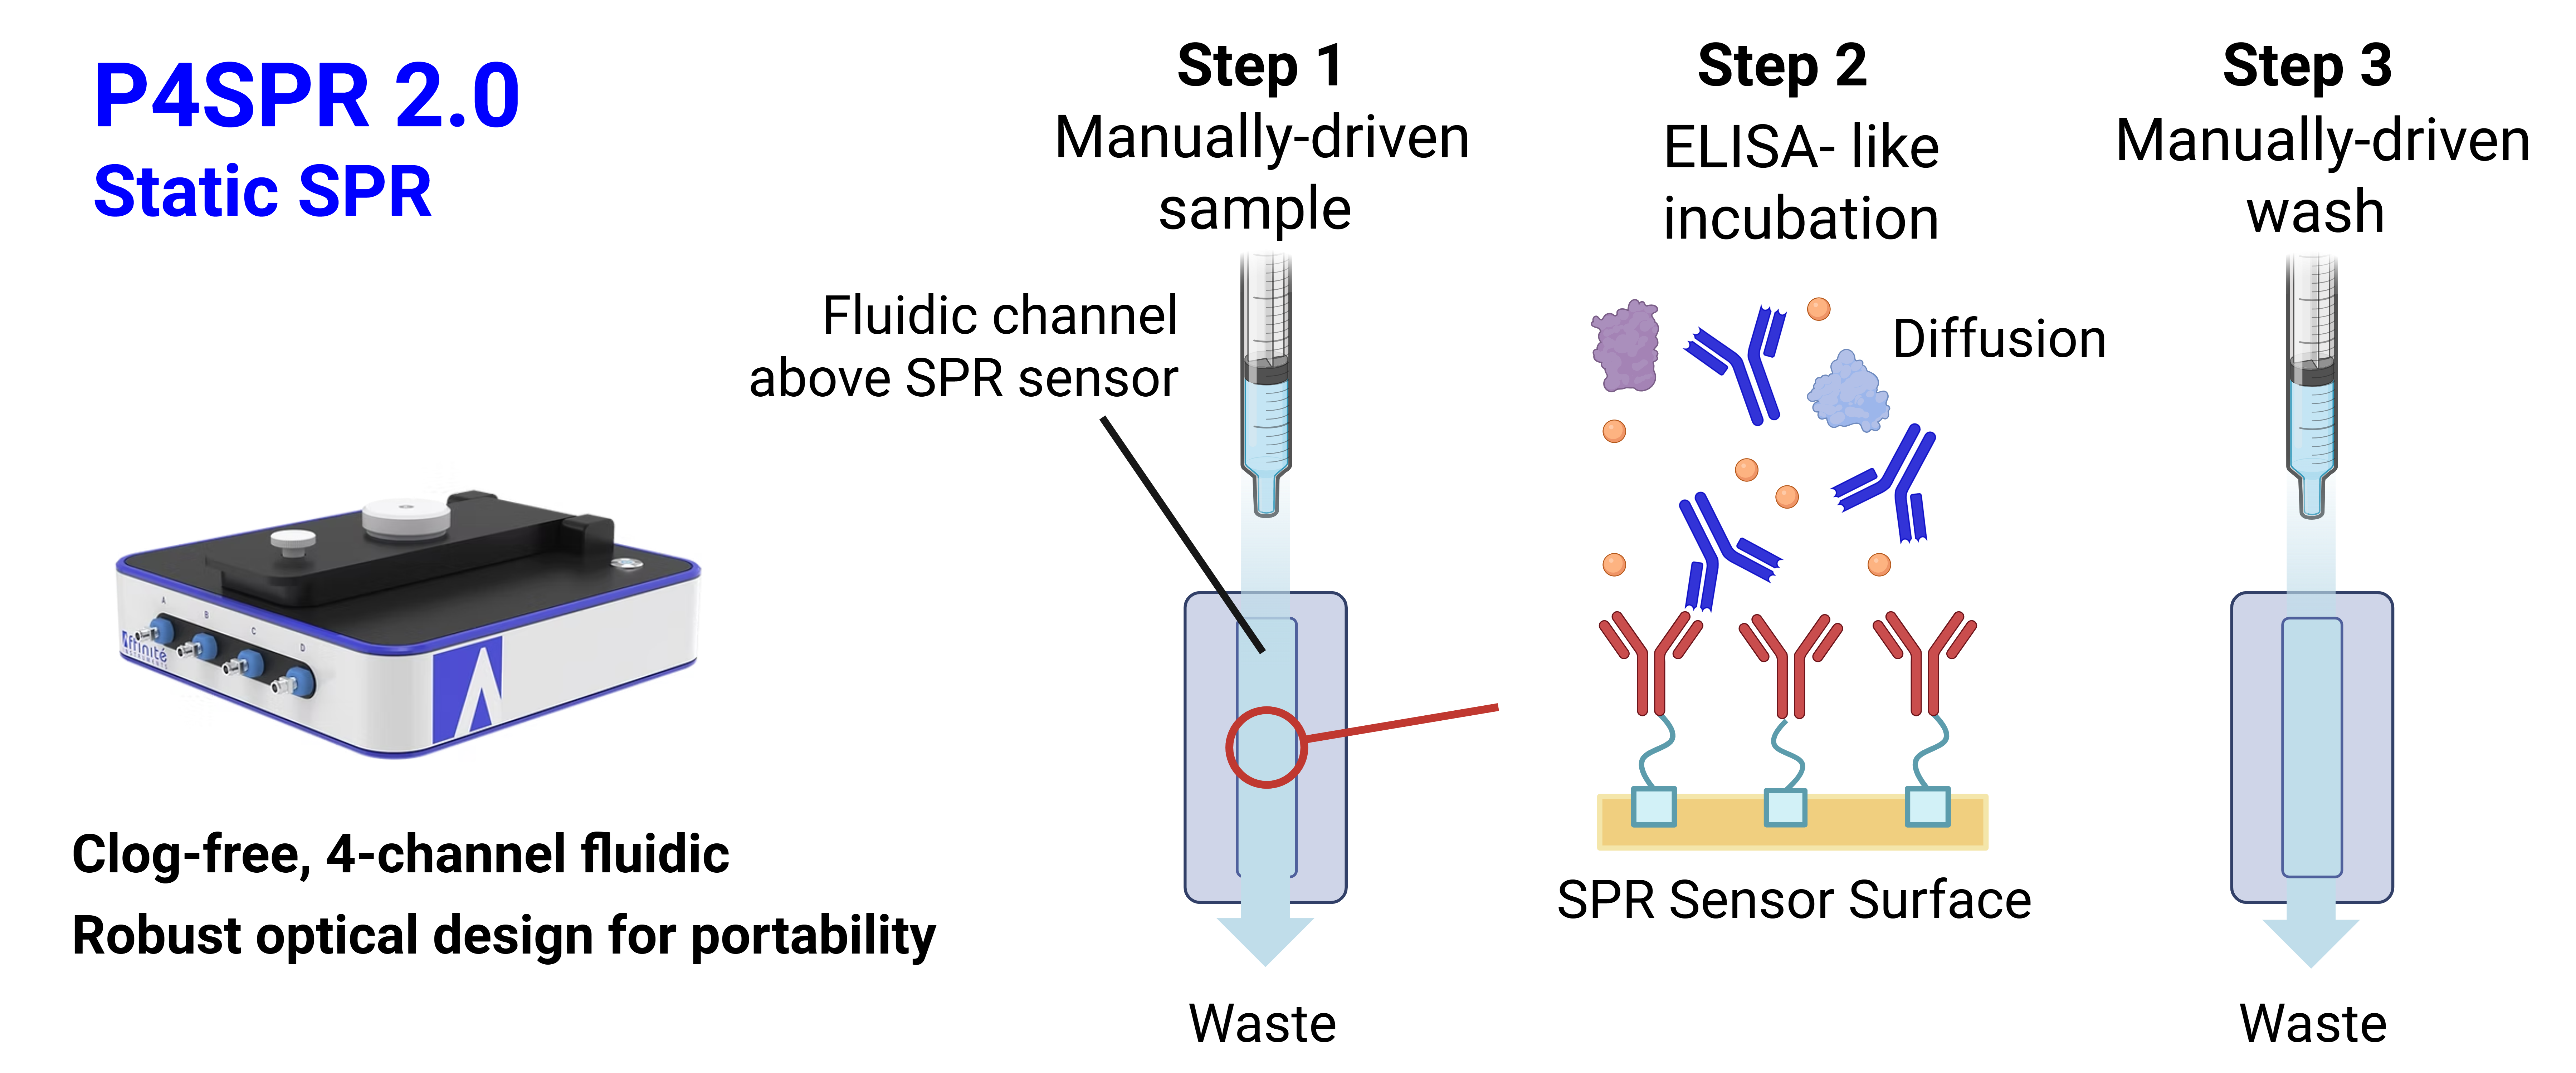
Static SPR — P4SPR 2.0
Well-suited for screening and quantification. Provides a snapshot of binding at steady state, allowing rapid analysis of large sample sets. Assay times can be up to half that of kinetic SPR, owing to simplified sample introduction, faster baseline establishment, and efficient flushing. Ideal for specificity screening, analyte quantification, and affinity characterization (KD).
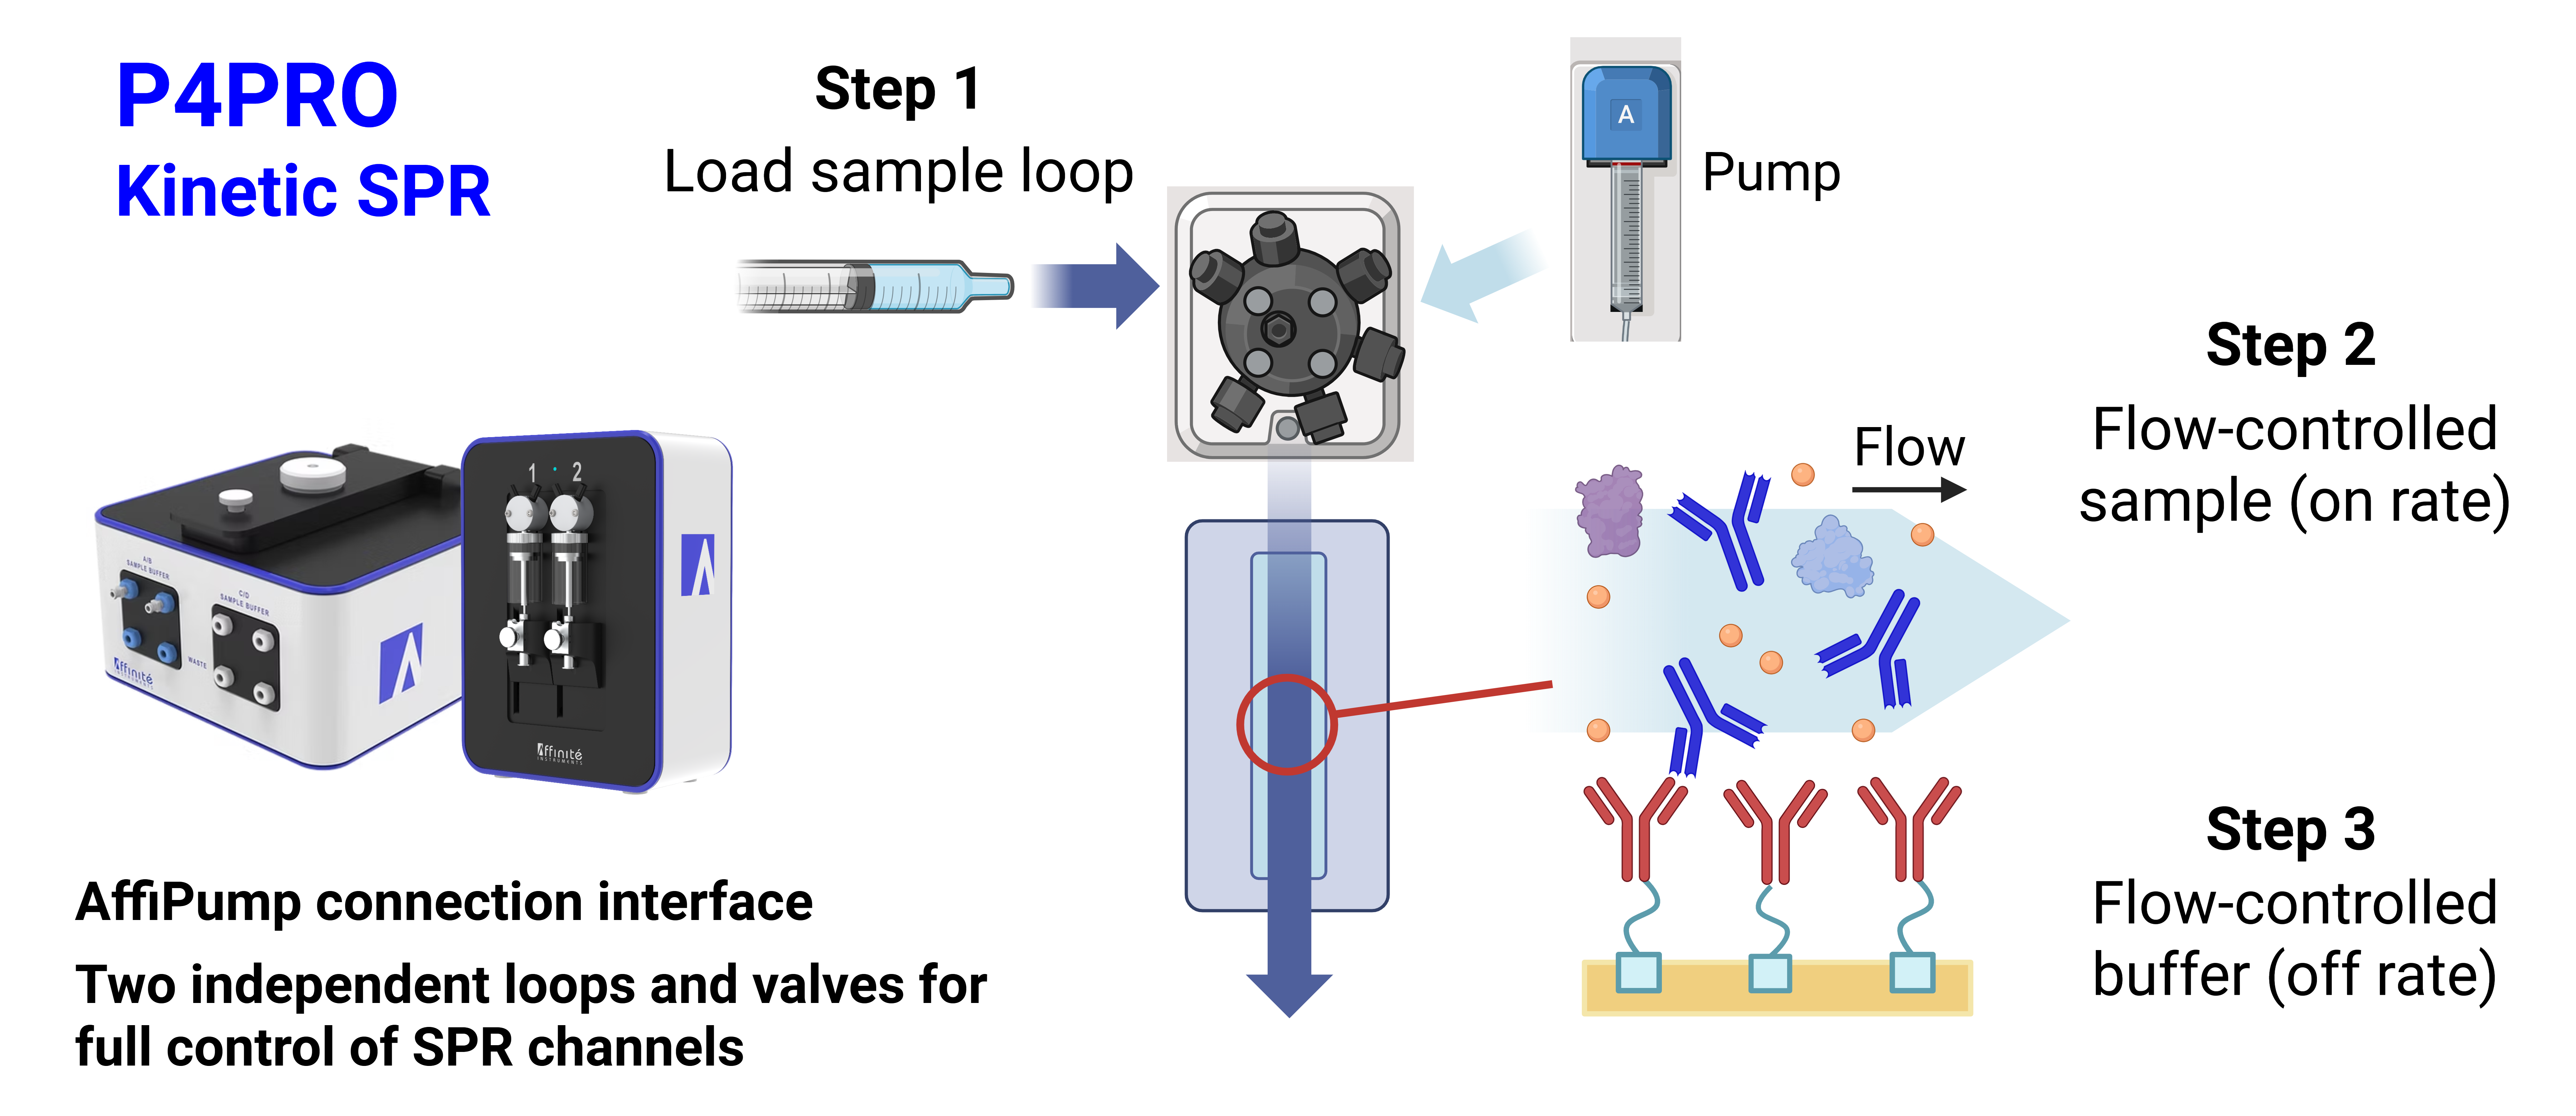
Kinetic SPR — P4PRO
Provides a complete picture of molecular interaction dynamics — including association rate (kon), dissociation rate (koff), affinity (KD), and maximum binding response (Rmax). By monitoring both association and dissociation phases in real time, kinetic SPR enables mechanistic interpretation of binding strength and drug residence time.

Instrumentation
Both Affinité instruments introduce sample through manual syringe injection. In the static P4SPR 2.0, the sample is introduced directly from the syringe inlet into the flow cell (Figure 1). In the P4PRO kinetic system, the sample is injected into a sample loop and flowed through the flow cell by the integrated Affipump (Figure 2).
Assay Design
Two analogous assays were run under the same conditions in static and kinetic systems. Affinité Instruments MHDA sensors were activated with a 1:1 (v/v) mixture of 30 mM EDC and 100 mM NHS for 4 minutes. Mouse anti-human IgG capture reagent was prepared at 5 µg/mL in 10 mM sodium acetate (pH 4.5) and injected manually for 30 seconds in sample channels. Surfaces were then deactivated with a 6-minute injection of 1M ethanolamine (pH 8.0).
Similar ligand densities of MAH IgG were immobilized across both surfaces (114 RU and 61 RU). Human IgG concentrations ranging from 0.89–72 nM (three-fold serial dilution) were prepared in PBS 1x + 0.1% Tween-20 (pH 7.4). Samples were injected for 600 s in the P4SPR 2.0 at ~100 µL/s, and for 150 s in the P4PRO at 50 µL/min. Surfaces were regenerated between injections with 10 mM glycine–HCl (pH 2.0).

Results
Static SPR — P4SPR 2.0
In static SPR, only the association phase is observable. The signal gradually increases as analyte binds to the immobilized ligand. Once most available sites are occupied, the signal reaches a plateau — the steady state — where association and dissociation are in equilibrium. The shape and kinetics of the rising curve provide qualitative information on binding affinity, association rate, and stoichiometry.

SPR shift values at steady state were plotted as a function of concentration and fitted using Affinité's ezControl software (Figure 5). From the curve fit, Rmax was evaluated at 63 RU and KD at 4.9 nM.

Kinetic SPR — P4PRO
In kinetic SPR, both association and dissociation phases are observable. During the association phase, analyte binds to the surface and the SPR signal rises. The rate of increase reflects kon. Once analyte injection ends, buffer displaces the analyte and the signal decreases — the rate of decrease reflects koff.
A relatively steep association slope indicates fast binding; a flat, slow dissociation slope — as seen here — indicates strong, long-lived antibody binding.

TraceDrawer global fitting of the kinetic data (Figure 7) yields full rate constants. The steep on-rate and slow off-rate confirm strong antibody binding with sub-nanomolar affinity.

Comparison of Results

In kinetic SPR, the interaction yielded kon = 3.42 × 10⁵ M−1s−1, koff = 3.10 × 10⁻⁴ s−1, KD = 1 nM, and Rmax = 83 RU. In static SPR, kon and koff are not individually observable; Rmax was evaluated at 63 RU and KD at 5 nM.
The modest difference in KD (5 nM static vs. 1 nM kinetic) reflects the static system's limitation: with a 600 s injection, lower-concentration curves do not fully reach true steady state. A longer analyte on-time would project a higher Rmax and a lower KD, bringing the static result closer to the kinetic measurement.
Summary
Static and kinetic SPR are complementary tools, not competing ones. The choice depends on what information is needed:
- P4SPR 2.0 (static) is faster, simpler, and more cost-effective for screening and quantification. Four samples can be analyzed simultaneously. KD values are accessible, and the simpler workflow enables rapid throughput.
- P4PRO (kinetic) provides the full kinetic profile — kon, koff, KD, and Rmax. This depth of information is essential when understanding binding mechanism, comparing antibody residence times, or supporting drug development decisions.
Used together, static screening narrows down candidates quickly while kinetic analysis characterizes the most promising interactions in detail.